Can I have Quarto page with margin notes?
Yeap!
\[ \overline{X} = \frac{\sum X_i}{n} \tag{1}\]
We can reference the Equation 1 inn the margin by @eq-sample-mean
::: {.column-margin}
$$
\overline{X} = \frac{\sum X_i}{n}
$$ {#eq-sample-mean}
:::
Another way to place equations in the margin is:
The Fundamental Theorem of Calculus
We know from the first fundamental theorem of calculus that for \(x\) in \([a, b]\):
\[ \frac{d}{dx}\left( \int_{a}^{x} f(u)\,du\right)=f(x). \tag{2}\]
::: {.column-margin}
### The Fundamental Theorem of Calculus
We know from *the first fundamental theorem of calculus* that for $x$ in $[a, b]$:

$$\frac{d}{dx}\left( \int_{a}^{x} f(u)\,du\right)=f(x).$$ {#eq-calc}
:::
::: {.column-margin}
::: {.callout-note}
**Rule #1** A paper with only theory is just an idea; a paper with only data is just a list.
:::
:::Rule #1 A paper with only theory is just an idea; a paper with only data is just a list.
Margins and citation in margins. Just add into the yaml …
---
format:
  html:
    reference-location: margin
    citation-location: margin
---
Now, whenever you use a footnote [^1] or a BibTeX citation [@Keynes1936], Quarto won’t put them at the bottom of the page—it will snap them into that shaded sidebar right next to where you mentioned them.
Aside
[This is a span that has the class aside which places it in the margin without a footnote number.]{.aside}Figure in the margin

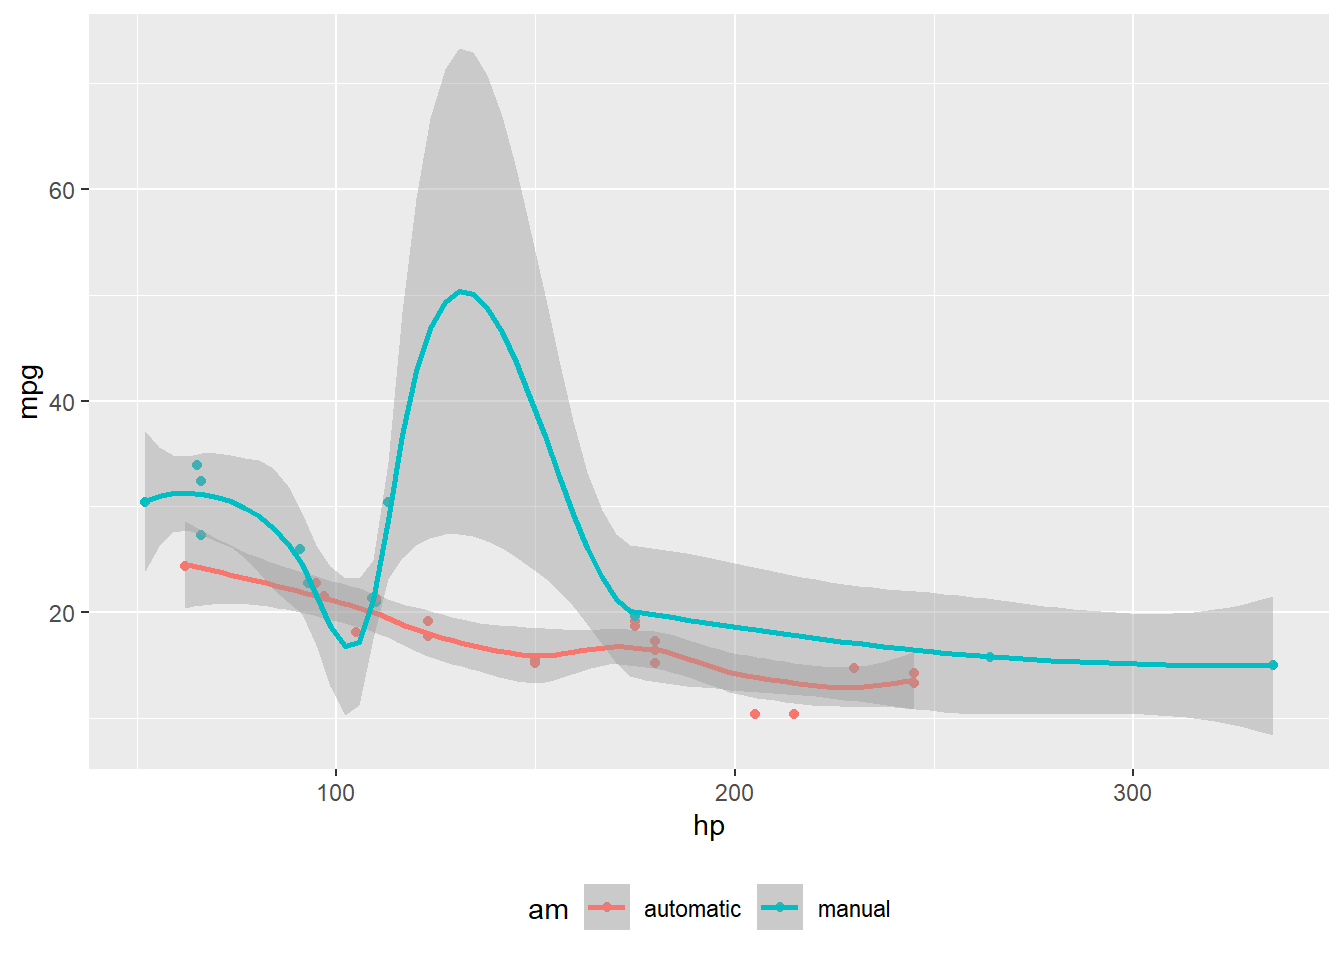
#| label: fig-mtcars
#| fig-cap: "MPG vs horsepower, colored by transmission."
#| column: margin

library(ggplot2)
mtcars2 <- mtcars
mtcars2$am <- factor(
  mtcars$am, labels = c('automatic', 'manual')
)
ggplot(mtcars2, aes(hp, mpg, color = am)) +
  geom_point() +
  geom_smooth(formula = y ~ x, method = "loess") +
  theme(legend.position = 'bottom')
Labels in the margin
#| label: fig-cap-margin
#| fig-cap: "MPG vs horsepower, colored by transmission."
#| cap-location: margin
#| out-width: "50%"

library(ggplot2)
mtcars2 <- mtcars
mtcars2$am <- factor(
  mtcars$am, labels = c('automatic', 'manual')
)
ggplot(mtcars2, aes(hp, mpg, color = am)) +
  geom_point() +
  geom_smooth(formula = y ~ x, method = "loess") +
  theme(legend.position = 'bottom')
A Very Wide Mathematical Proof
This text and the equation below will stretch across the entire width of the page, ignoring the sidebar we created. This is perfect for long horizontal derivations: \[ Y_{i,t} = \alpha + \beta_1 X_{i,t} + \beta_2 Z_{i,t} + \gamma_i + \delta_t + \epsilon_{i,t} + \dots + \text{lots of other control variables} \]
::: {.column-page}
### A Very Wide Mathematical Proof
This text and the equation below will stretch across the entire width of the page, ignoring the sidebar we created. This is perfect for long horizontal derivations:
$$
Y_{i,t} = \alpha + \beta_1 X_{i,t} + \beta_2 Z_{i,t} + \gamma_i + \delta_t + \epsilon_{i,t} + \dots + \text{lots of other control variables}
$$
:::
Or
#| column: page
#| echo: false
# This table will now use the full width of the document
modelsummary::modelsummary(model_list)
::: {.column-page .text-center}
This is a wide, centered announcement or header.
:::